
A charting example using weather data from a MySQL database populated by the VWSql utility.
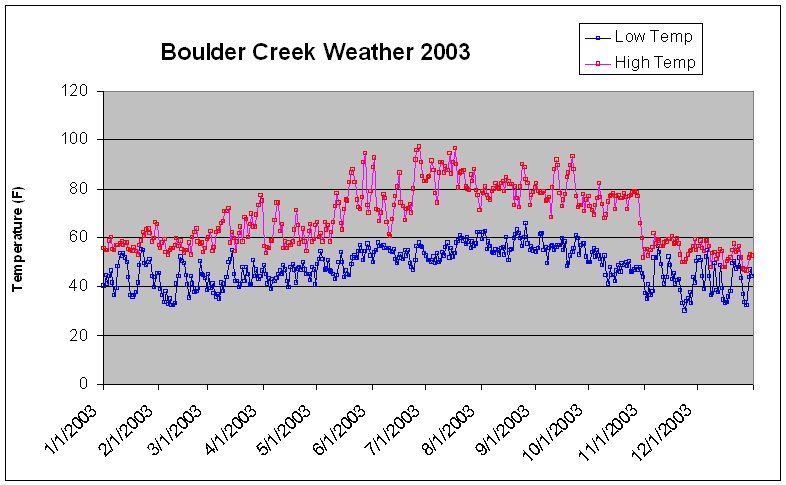
| Data was populated into a MySQL database running on a Linux system, using the VWSql utility that feeds data from VWS, the Virtual Weather Station (running on a Windows98 box connected to an Oregon Scientific WMR968 weather station). A Perl script was then written to walk through the main data table and populate an aggregate database table with the recorded highs and lows by date. The sample Perl DBI script is here (caveat: spot testing shows 99% accuracy - still under development). MS Excel was then used with the MySQL ODBC driver (running on a Windows XP Pro box) to query the aggregate table to generate the above quick n' dirty graph (caveat: Excel may have dropped data points). The schema of the aggregate data table (bc_temp) is shown below: |
| Field | Type | Null | Key | Default |
| Rec_Date | Date | PRI | 0000-00-00 | |
| RecDate | varchar(13) | YES | NULL | |
| hitemp | float(7,3) | YES | NULL | |
| hitime | varchar(4) | YES | NULL | |
| lotemp | float(7,3) | YES | NULL | |
| lotime | varchar(4) | YES | NULL | |
| dirty | char(1) | YES | NULL |
| Further development is expected soon utilizing Perl charting modules (under research) for natively generating charts via cronjobs on the Linux box. Learning Perl from the seat of my pants! |
|
||
| Copyright © 2002 All rights reserved Boulder-Creek.com. | ||
| Unauthorized duplication or distribution is prohibited. | ||
| Never base important decisions on this or any weather information obtained from the Internet | ||
| Updated Automatically by Ambient Software's Virtual Weather Station Version 12.07 |
Send comments to webmaster@boulder-creek.com.
Revised: 19 Aug 2004 00:21 -0700